Meridian Resorts
Hospitality Operations & Portfolio Intelligence
A revenue intelligence dashboard for Meridian Resorts to monitor property occupancy, room rates, channel mix, and daily resort performance.
Hospitality & Resorts
BI Engineering, Dashboard Build
3 Weeks
Next.js, TypeScript, Tailwind
The Problem
Resort general managers and operations teams tracked daily guest bookings across disconnected property management systems and third-party booking extranets. Operational bottlenecks and occupancy dips were caught too late.
Before
- •Scattered Property Data: Front desk systems, point-of-sale feeds, and OTA reports lived in separate tools.
- •Manual Rate Updates: Room pricing and rate adjustments were calculated by hand across channels.
- •Delayed Occupancy Signals: Managers lacked early warnings when seasonal bookings fell behind target pace.
Goals
- •Unified Operations Platform: View all resort occupancy, room rates, and daily revenue in one place.
- •Live Channel Monitoring: Track direct bookings versus third-party travel agencies to protect room margins.
- •Fast Inventory Insights: Surface room turnaround times and cancellation trends across resort properties.
Requirements
Interviews with resort leadership, general managers, and developers defined core requirements:
Leadership Team
Portfolio Strategy & Asset Performance
"Which resorts meet our occupancy and revenue targets, and where are operational margins slipping?"
Portfolio summary tracking occupancy, average daily rates, and net revenue across properties.
Hotel Operations & GMs
Daily Guest Operations & Inventory
"Which room categories have high cancellation rates, and how fast are rooms turned around for check-in?"
Room inventory tables, booking lead times, and channel distribution breakdowns.
Operations & Developers
Data & Systems
"How do we sync reservation data from multiple property systems into one clean database?"
Supabase database, fast Next.js queries, and instant property filters.
Engineering & Build Process
A focused 3-week sprint from hotel operational audits to a working frontend application:
Audit & Requirements
Audited property management feeds, room types, and reservation workflows across resorts.
Data Architecture & Layout
Organized data into 3 dedicated analytics views for portfolio, property, and rooms.
Data Modeling & Viz
Engineered high-contrast rate pacing curves, channel mix graphs, and room inventory tables.
Frontend Build
Built the Next.js app with fast filters, Supabase queries, and responsive charts.
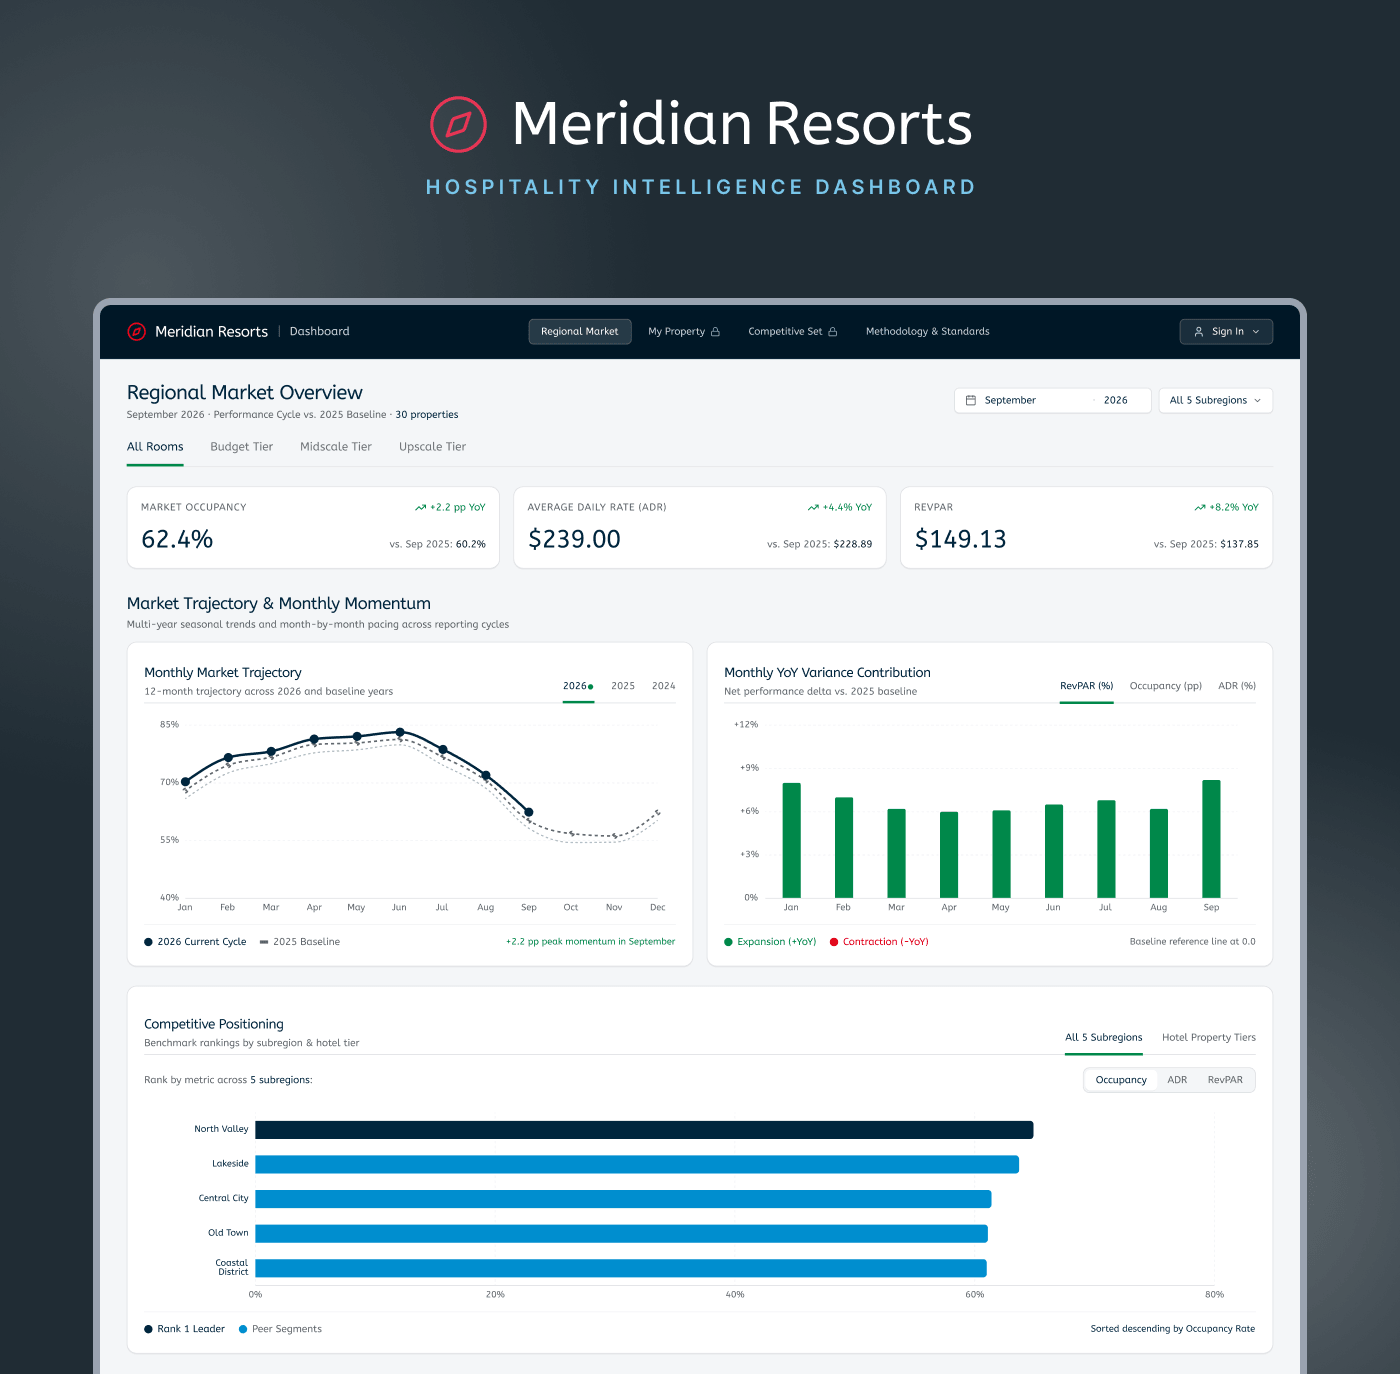
Portfolio Overview
Tracks occupancy, room rates, and revenue across all resort properties.
Key Decisions
Simple interface choices directly informed by hotel operations teams:
Top Performance Cards
Core metrics like occupancy and average daily rates were spread across separate reports.
Cards at the top displaying daily rates, occupancy pace, and target comparisons.
Channel Mix Breakdown
Managers struggled to see how much booking commission was paid to third-party travel sites.
A clean visual breakdown comparing high-margin direct bookings against travel agencies.
Room Asset Ledger
Front desk managers had to dig through deep tables to spot room maintenance delays.
An inventory table grouping rooms by category with turnaround status and lead times.
Pacing Comparison Chart
Teams had no clear view of whether upcoming weekend reservations were ahead or behind.
Pacing curves comparing current reservation velocity against previous seasons.
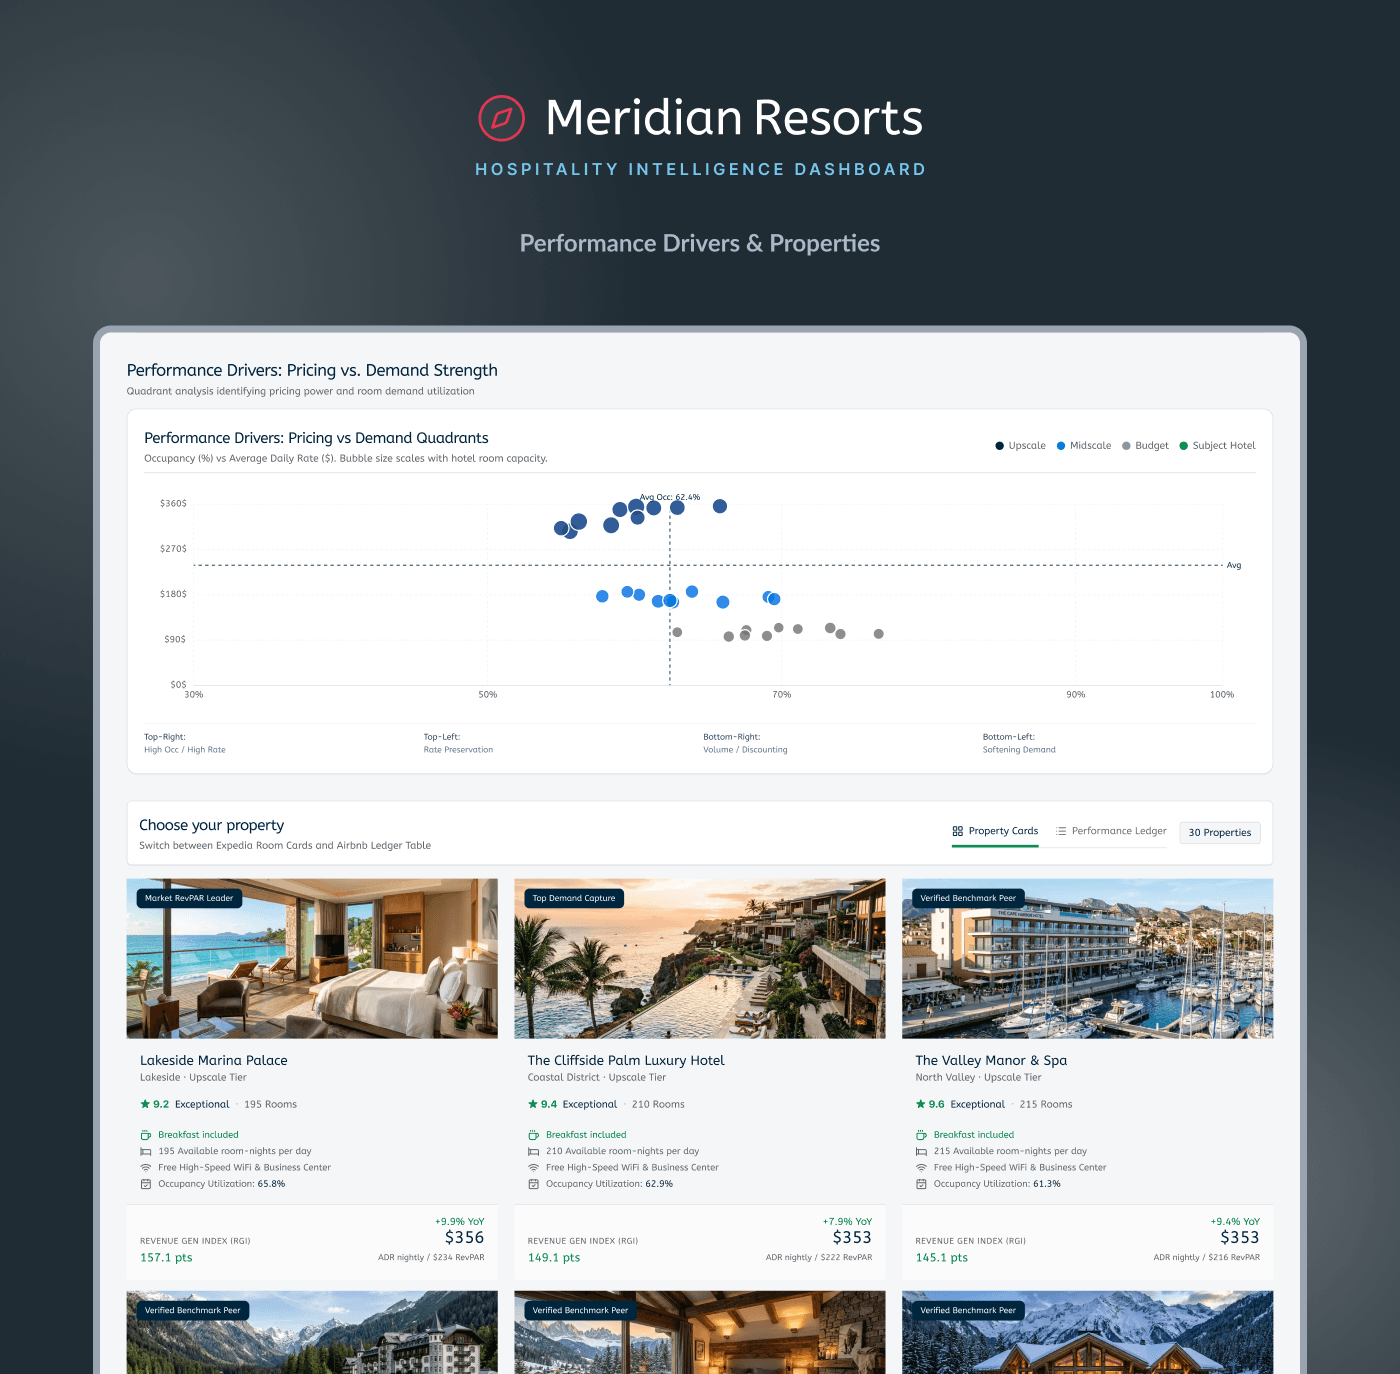
Property Performance
Breaks down booking channels, rate sensitivity, and occupancy across individual resorts.
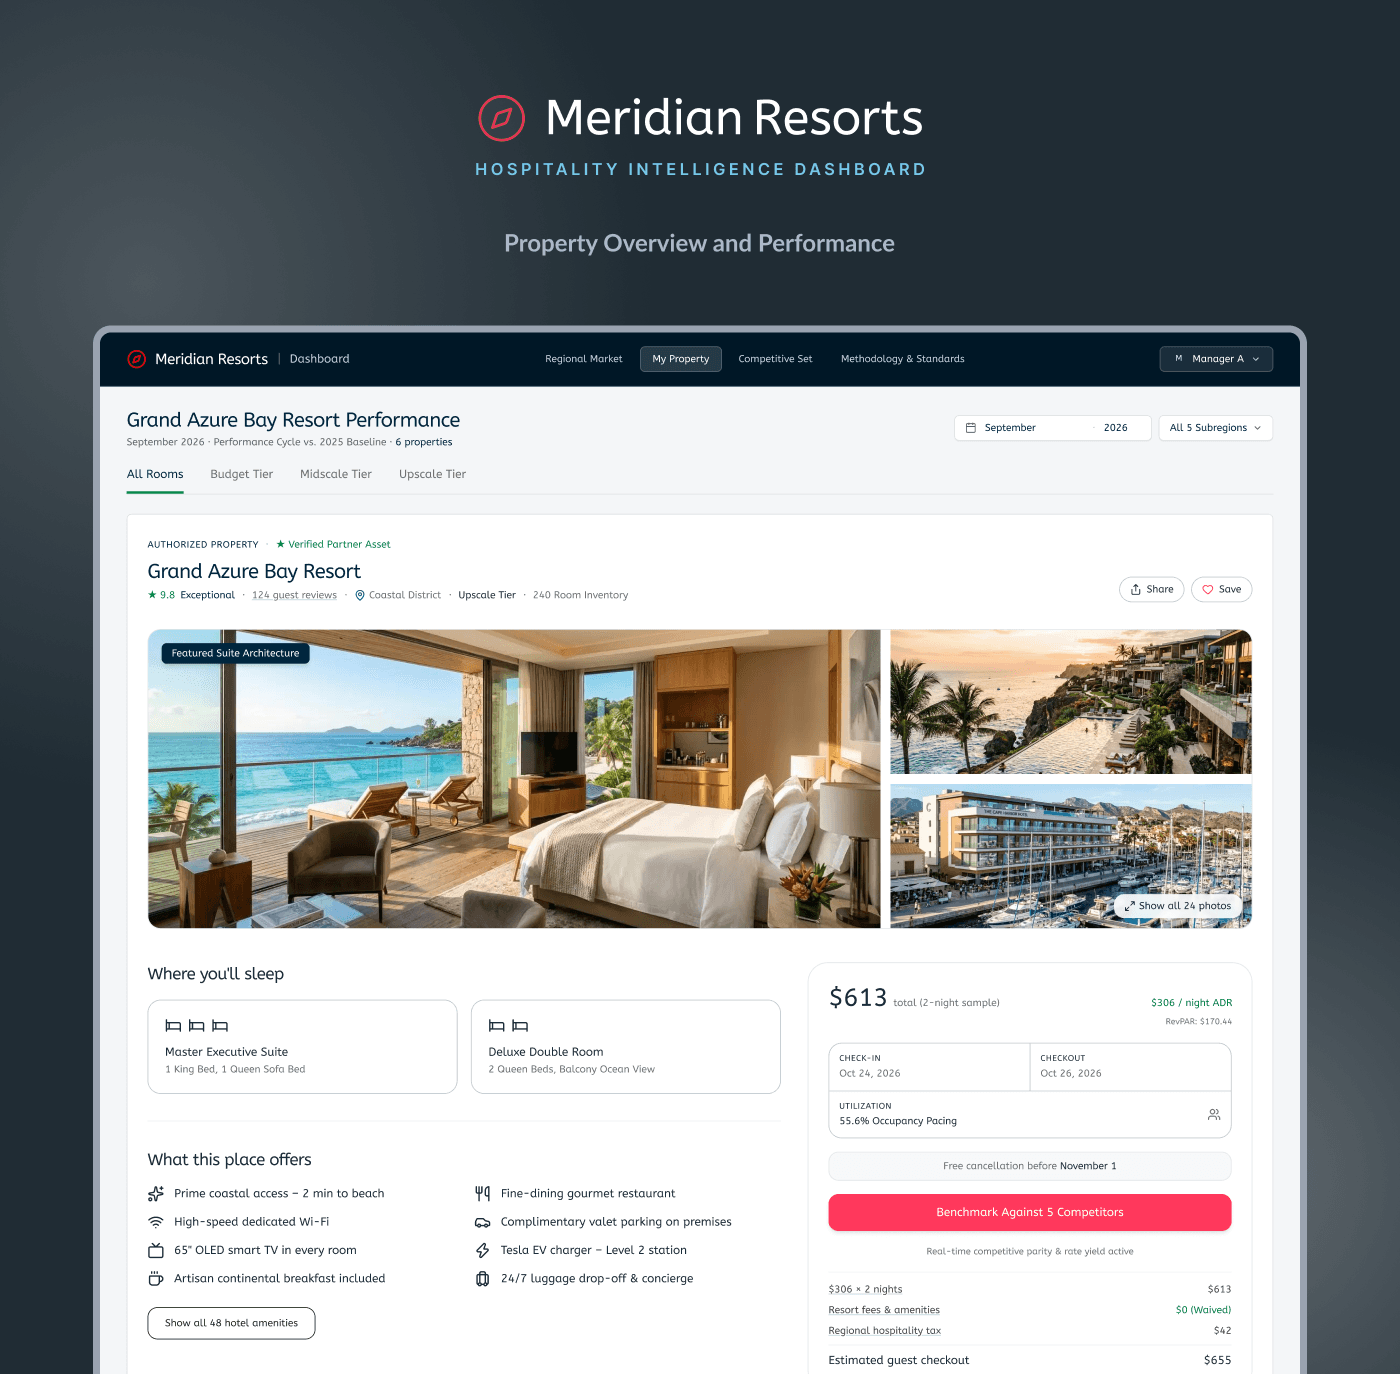
Room Asset Ledger
Monitors room categories, turnaround times, and cancellation rates by booking window.
Tech Stack
A clean, modern setup built for fast loading and responsive filtering:
Data Sources
Syncs reservations, front desk check-ins, and point-of-sale data.
Property & PMS APIsDatabase
Stores guest bookings, room inventories, and rate tables in Supabase.
SupabaseServer Logic
Calculates occupancy rates, channel fees, and pacing velocity on demand.
Next.js Server ActionsUser Interface
Clean interface with interactive charts, dark mode, and room tables.
Next.js & TailwindResults & Impact
The new dashboard gave hotel operations teams clear numbers they could trust:
Modular Analytics Architecture
Built a modular component architecture with reusable React rate charts and room inventory tables for future resort screens.
Automated PMS Sync
Connected property management feeds directly into Supabase, removing manual spreadsheets.
Standardized Hotel Metrics
Unified formulas for occupancy, ADR, RevPAR, and commission costs across all resorts.
Faster Pricing Decisions
Gave general managers instant visibility into pacing and room turnover before peak seasons.
Ongoing Maintenance & Usability
After delivering the dashboard, work shifted to fixing bugs, improving usability, adding new metrics, and adjusting existing calculations.
Planning Additional Data Sources
Planning new point-of-sale integrations and guest feedback feeds to expand operational visibility.
Gallery
All dashboard views developed for the platform. Click any view to inspect full size: