NutreaLabs
Paid Ads & Creative Analytics Dashboard
A custom dashboard that connects Meta and Google ad spend with real store sales for clear daily tracking.
The Problem
The marketing team used separate ad platform reports that showed conflicting numbers. Without a clear view of real store sales, it was hard to spot ad fatigue and manage spend.
Before
- •Conflicting Numbers: Meta and Google took credit for the same orders.
- •Creative Fatigue: Declining video ads went unnoticed for days.
- •Manual Spreadsheets: The team spent hours combining CSV files to track daily spend.
- •Slow Decisions: Missing daily numbers delayed budget adjustments.
Goals
- •Unified Overview: Track ad spend and store sales in one place.
- •Video Retention: Spot viewer drop-offs and ad fatigue in real time.
- •Funnel Clarity: Separate new customer ads from retargeting campaigns.
- •Daily Trends: Follow hourly sales to allocate budget with confidence.
Requirements
Interviews across media buyers, designers, and leadership shaped the dashboard around key requirements:
Performance Media Buyers
Daily Budget & Pacing
"Which campaigns are performing well today, and where should we increase budget?"
Live spend velocity, budget pacing, and creative fatigue alerts.
Creative Strategists
Video Hooks & Ad Angles
"Which video hooks keep viewers watching, and which ads need refreshing?"
3-second hook drop-off curves and performance by ad angle.
Marketing Leadership
Total Revenue & Profitability
"What is our overall return on ad spend, and are we growing profitably?"
Blended performance scorecard comparing total ad spend to real store revenue.
Engineering & Build Process
A focused 3-week sprint from initial data checks to a working frontend application:
Data Audit
Mapped ad accounts and store sales to fix double-counting and delayed reports.
Information Structure
Organized 5 dedicated screens for campaign overview, funnels, and video creative.
Data Modeling & Viz
Engineered clean ROAS pacing curves, video retention drop-off graphs, and modular metric cards.
Frontend Engineering
Built a fast Next.js app with instant filtering, date selectors, and video previews.
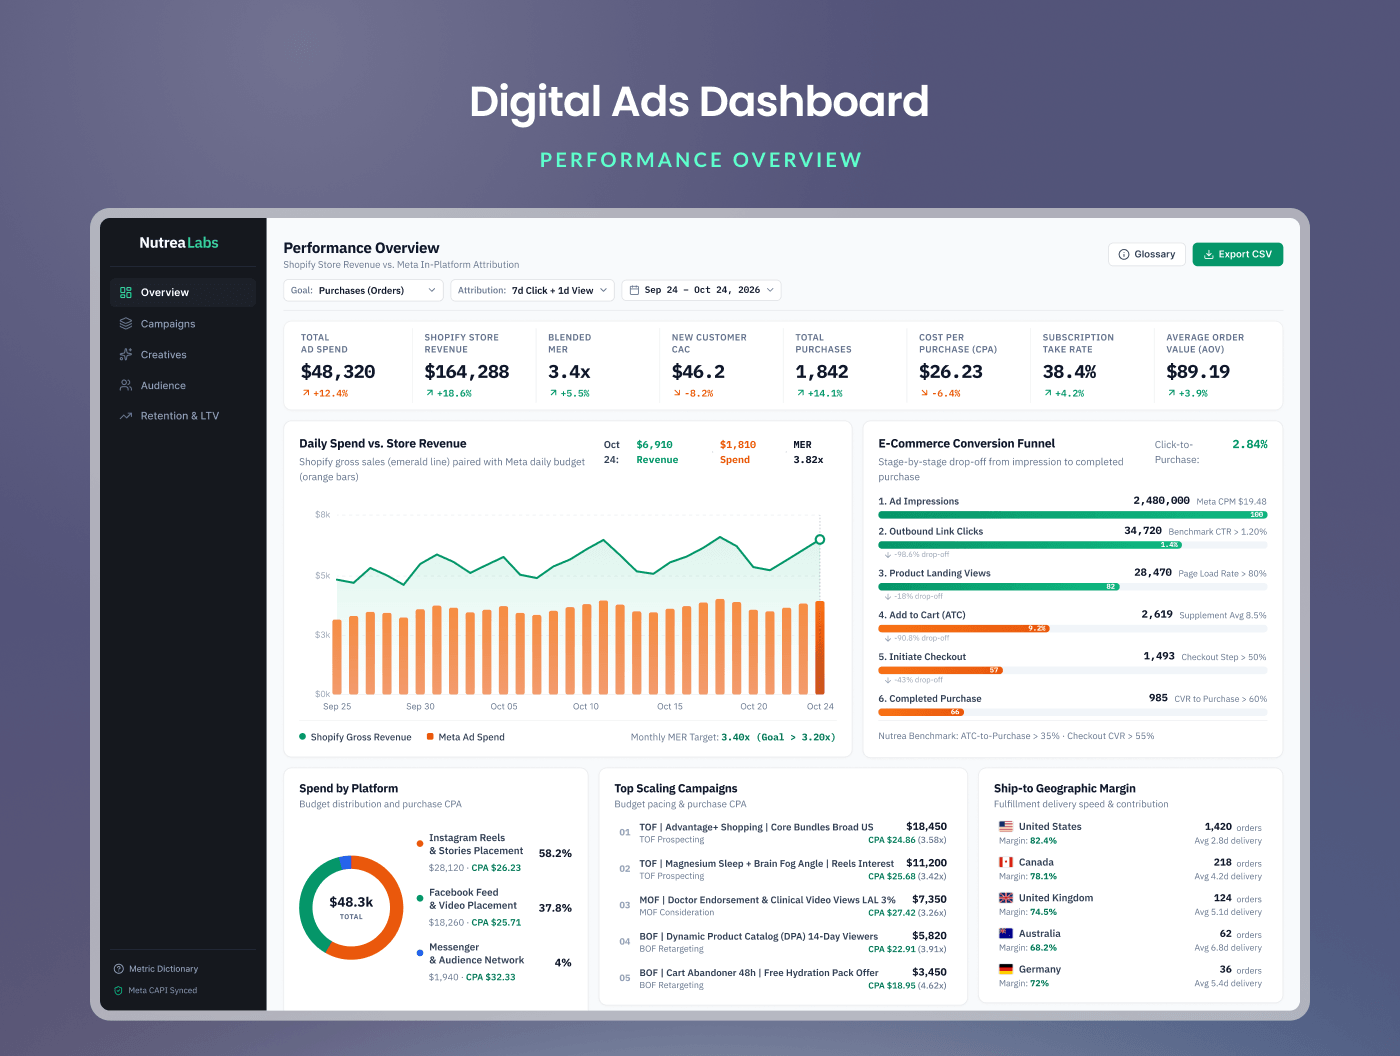
Revenue & Ad Spend Overview
Tracks total ad spend, store revenue, blended return, and customer acquisition cost with daily pacing trends.
Key Decisions
Simple interface solutions to solve daily media buying problems:
Unified Spend & Revenue
Separate ad platforms claimed credit for the same orders.
Connected total ad spend directly to real store sales.
Video Hook Drop-Off Curves
Click rates did not show when viewers stopped watching.
Visualized 3-second hook drop-offs to catch ad fatigue early.
Funnel Stage Segmentation
Mixing prospecting and retargeting hid cold audience costs.
Separated new-customer and retargeting budgets into dedicated views.
Hourly Spend Trajectory
Midday conversion dips caused premature budget changes.
Added hourly curves against 30-day baseline trends.
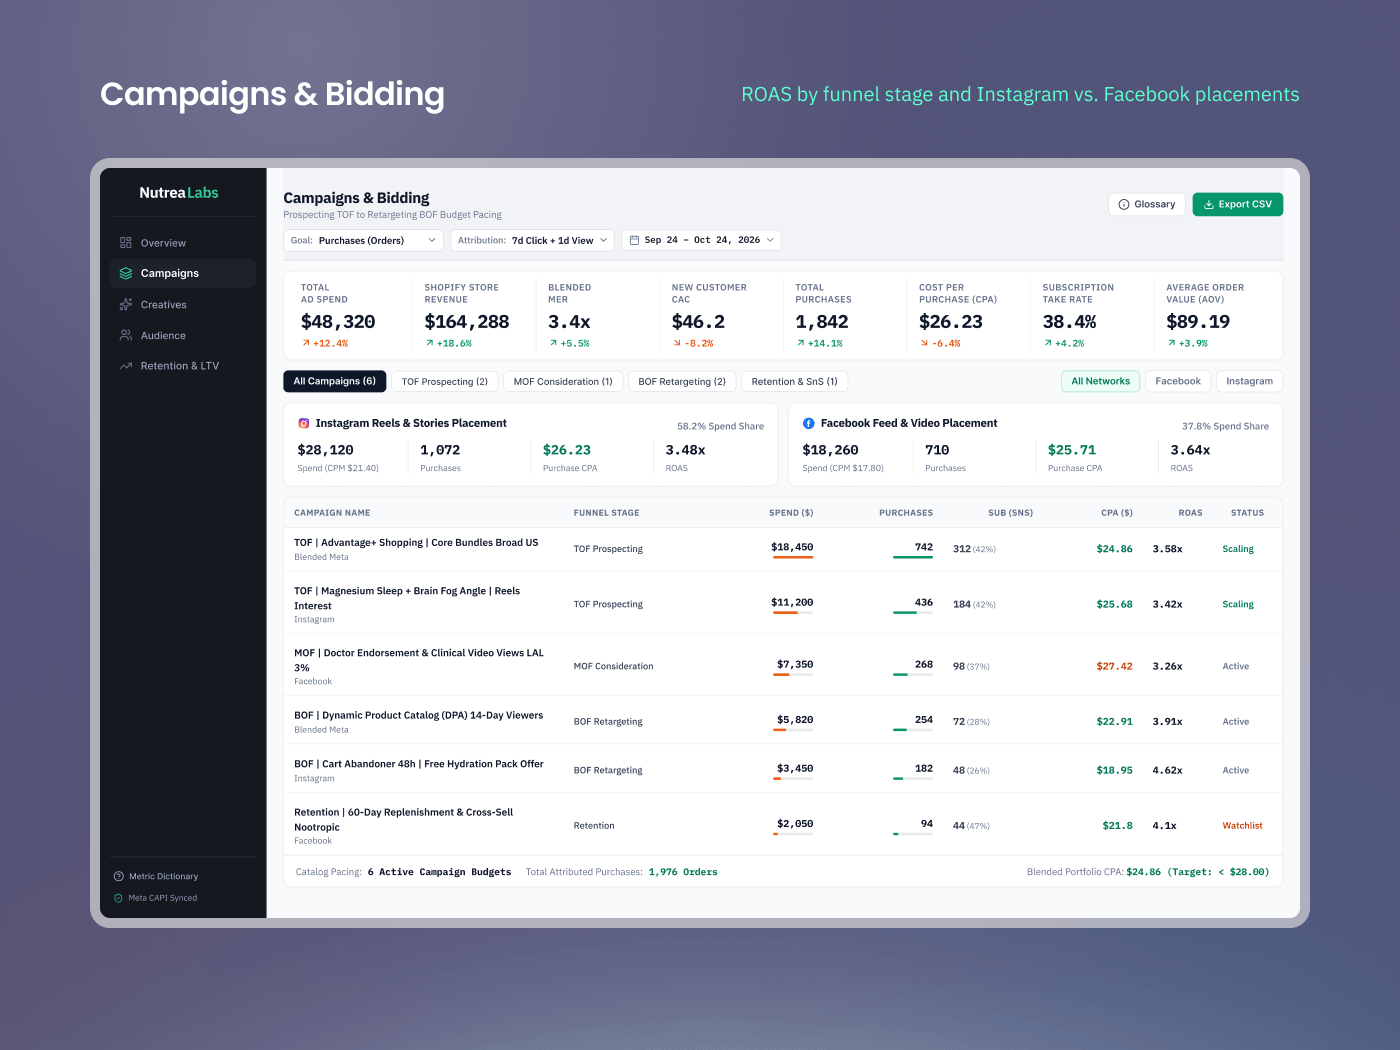
Campaigns by Funnel Stage
Separates prospecting, consideration, and retargeting to protect cold customer growth while managing return.
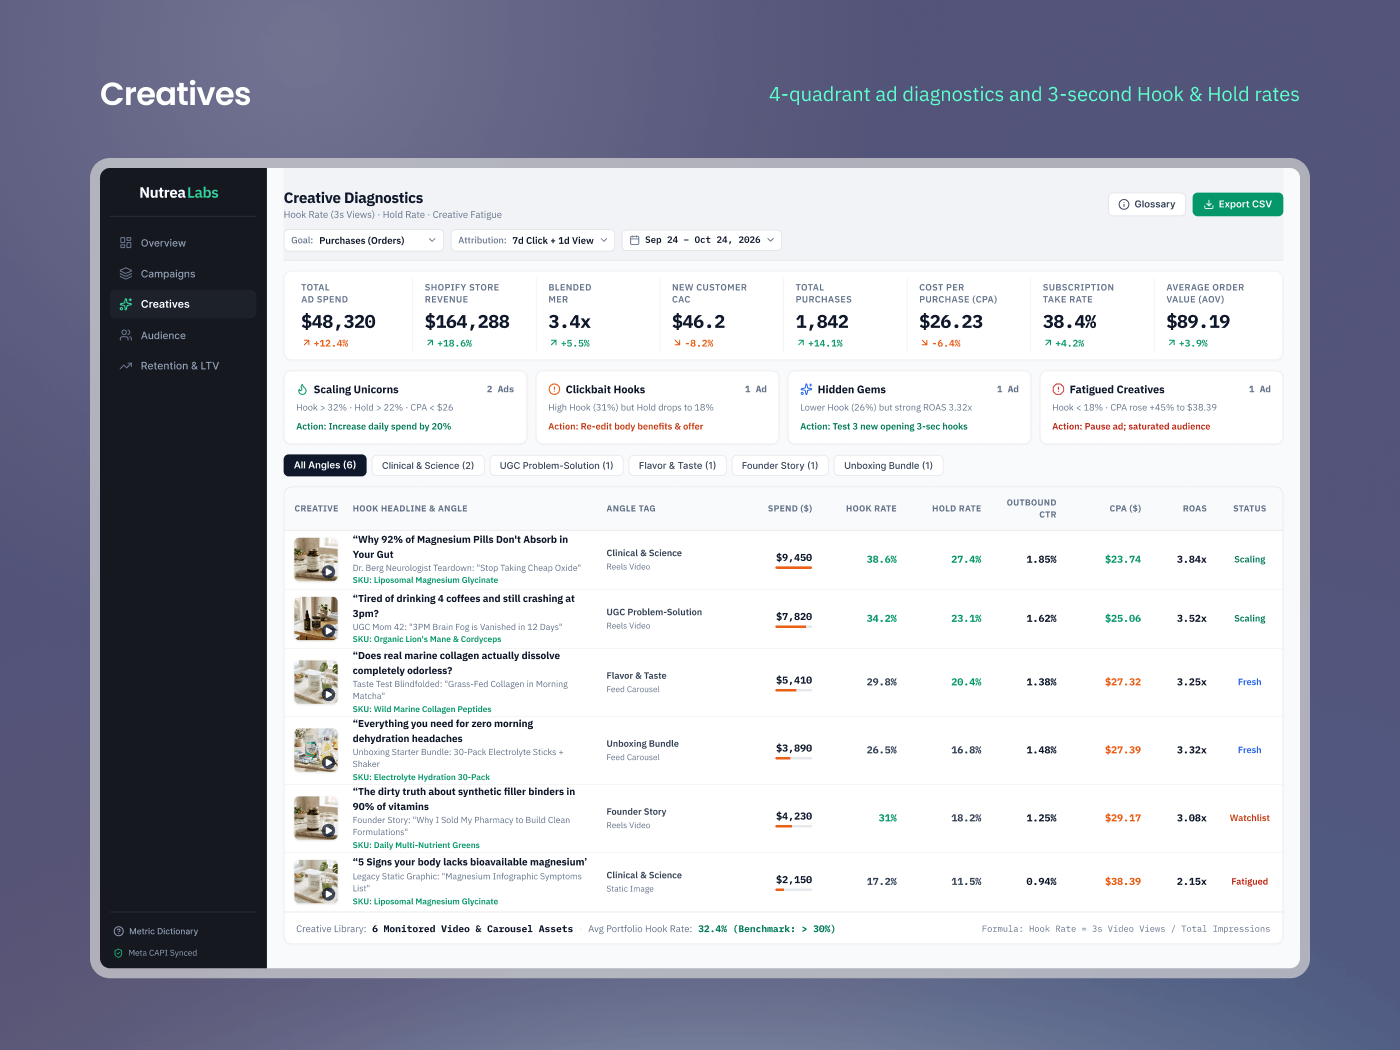
Video Ad Performance
Tracks 3-second hook retention, average watch time, and conversion rates across Meta Reels and TikTok.
Tech Stack
A clean, modern setup built for fast loading and responsive filtering:
Data Sources
Syncs daily ad spend, impressions, and sales across channels.
Marketing APIsData Warehouse
Stores ad records and matches them with Shopify store orders.
BigQuery WarehouseQuery Layer
Calculates daily marketing efficiency and retention curves on demand.
Next.js Server ActionsUser Interface
Clean visual interface with responsive charts, dark mode, and video previews.
Next.js & TailwindResults & Impact
The new system gave the marketing team clarity and confidence in daily ad budget decisions:
Modular Analytics Architecture
Built a modular component architecture with reusable React analytics cards and chart primitives for rapid feature scaling.
Automated Data Sync
Connected ad spend and store sales into an automated pipeline, replacing manual spreadsheets.
Single Source of Truth
Standardized metric calculations across channels, eliminating conflicting platform numbers.
Faster Budget Decisions
Gave media buyers clear visibility into ad fatigue and pacing to scale winning campaigns safely.
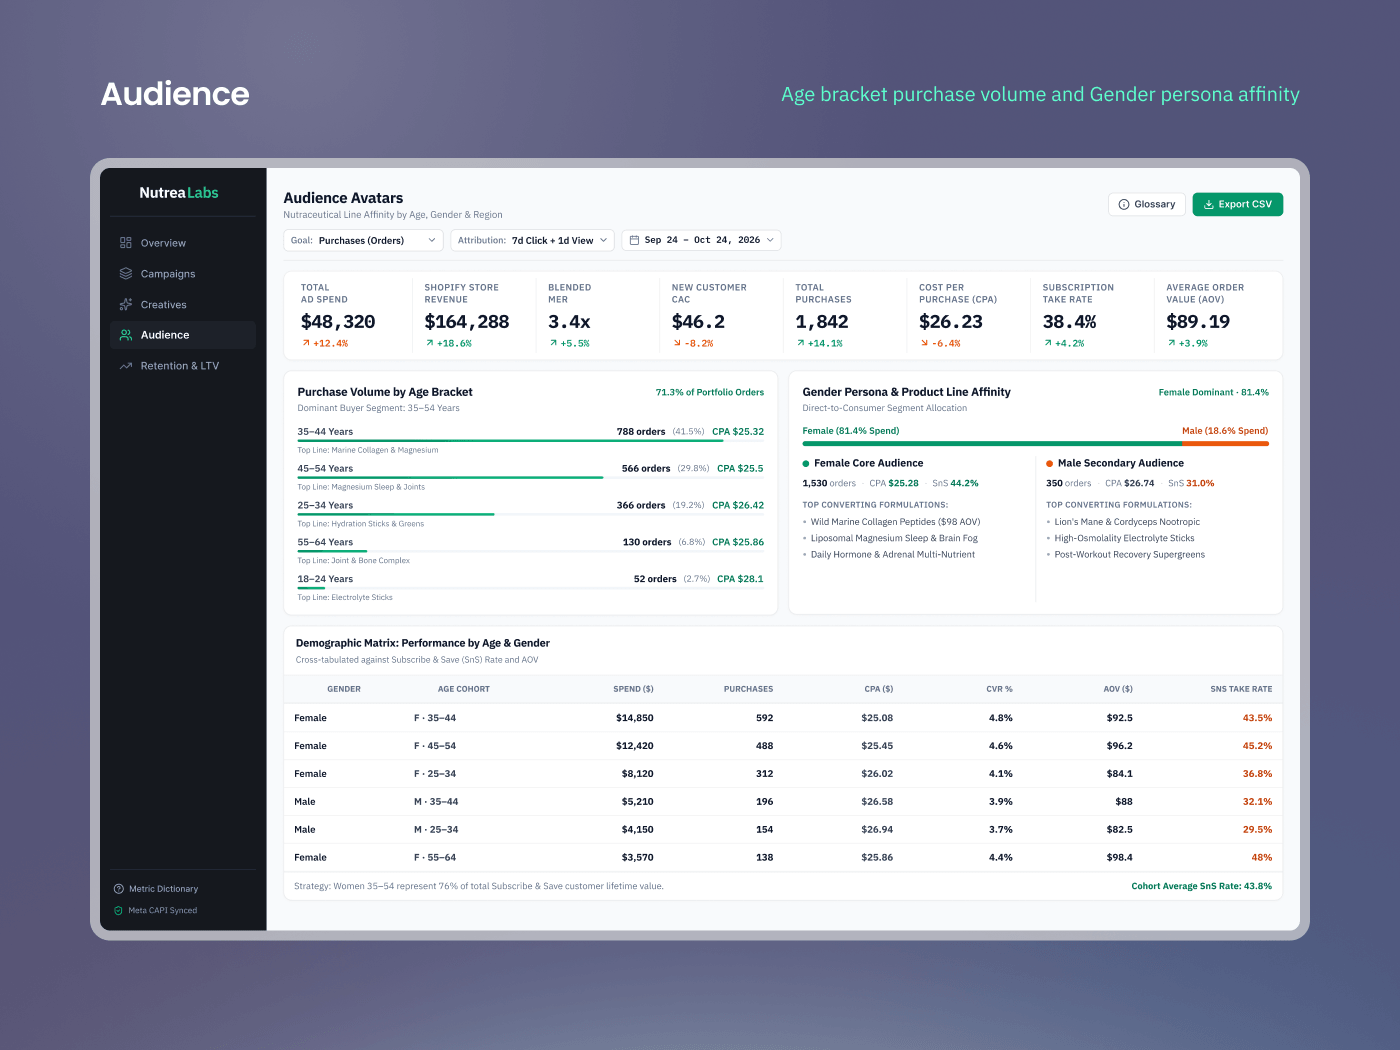
Channel Attribution Matrix
Compares platform-reported numbers against direct store orders to detect channel overlap.
Ongoing Maintenance & Usability
After delivering the dashboard, work shifted to fixing bugs, improving usability, adding new metrics, and adjusting existing calculations.
Planning Additional Data Sources
Planning the addition of new ad platform and store data sources to expand reporting across emerging marketing channels.
Gallery
All dashboard views developed for the platform. Click any view to inspect full size: