Sky Properties
Commercial Real Estate Investment & Asset Intelligence
An investment dashboard for Sky Properties to track portfolio values, rental yields, debt covenants, and upcoming lease expirations.
Real Estate Investment
BI Engineering, Dashboard Build
3 Weeks
Next.js, TypeScript, Tailwind
The Problem
The investment team tracked properties across separate spreadsheets and static PDF reports. Important lease rollovers and loan risks were often noticed too late.
Before
- •Scattered Spreadsheets: Property values and rental income lived in separate files.
- •Manual Debt Tracking: Loan terms and debt coverage ratios were calculated by hand.
- •Missed Lease Dates: The team had no early warnings for upcoming vacancies.
Goals
- •Single Dashboard: View all property values, income, and yields in one place.
- •Live Risk Tracking: Monitor loan covenants and lease expirations automatically.
- •Clear Action List: Highlight properties needing review or refinancing each quarter.
Requirements
Interviews with leadership, asset management, and development teams shaped core requirements:
Leadership Team
Portfolio Yield & Capital Allocation
"Which properties hit our yield targets, and where is our capital at risk?"
Clear summary of property values, rental income, and quarterly returns.
Asset Managers
Tenant Leases & Operations
"Which leases expire this year, and which buildings need immediate attention?"
Lease expiration schedules, occupancy rates, and operating costs.
Operations & Developers
Data & Systems
"How do we keep rent rolls and loan details updated without errors?"
Supabase database, fast Next.js queries, and instant property filters.
Engineering & Build Process
A focused 3-week sprint from financial model audits to a working frontend application:
Audit & Requirements
Audited rent rolls, property financials, and loan terms across all buildings.
Data Architecture & Layout
Organized reporting into 4 core views for yield, operating costs, debt covenants, and asset priorities.
Data Modeling & Viz
Engineered responsive yield gauges, lease expiration schedules, and asset ledger tables.
Frontend Build
Built the Next.js app with fast filters and interactive charts.
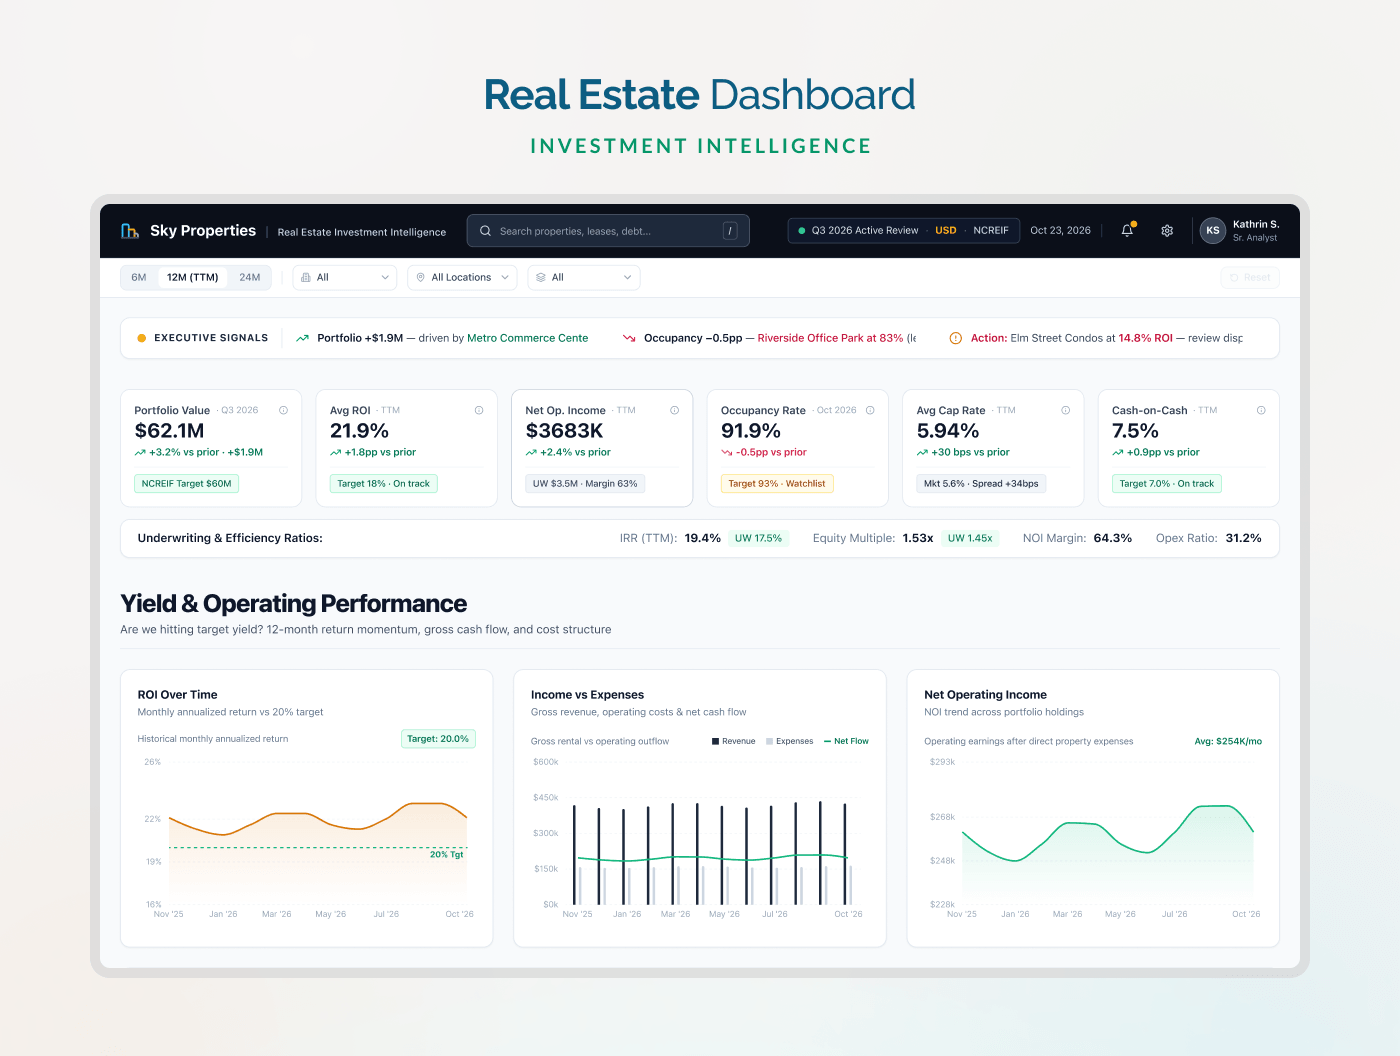
Yield & Operating Performance
Tracks portfolio value, ROI, and net operating income with alert indicators.
Key Decisions
Simple interface choices directly informed by team needs:
Top Metric Cards
Key numbers like NOI, cap rate, and returns were buried in spreadsheets.
Cards at the top showing current figures, targets, and alert badges.
Visual Debt Gauge
Lender coverage ratios were hard to read quickly in large tables.
A simple gauge showing the 1.55x ratio with a clear safety buffer.
Lease Expiration Chart
Managers could not quickly see which square footage expired each year.
A simple bar chart showing expiring space year by year.
Priority Task Cards
Property reviews created long notes without clear owners.
Ranked action cards sorted by urgency with assigned team members.
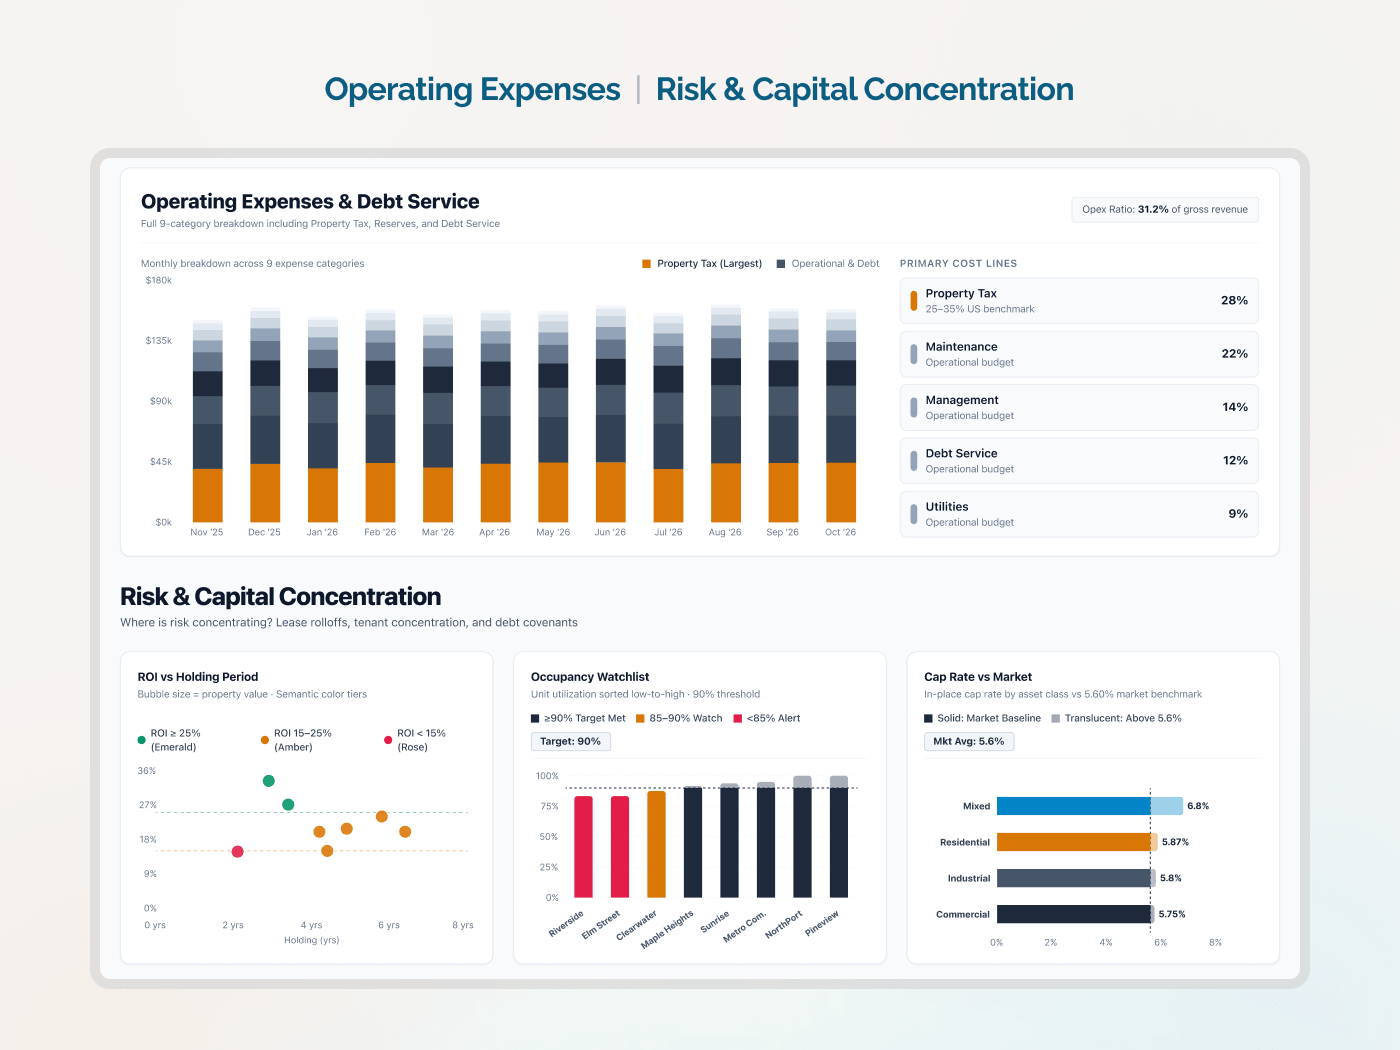
Operating Expenses & Risk
Breaks down costs across 9 categories with occupancy and holding period charts.
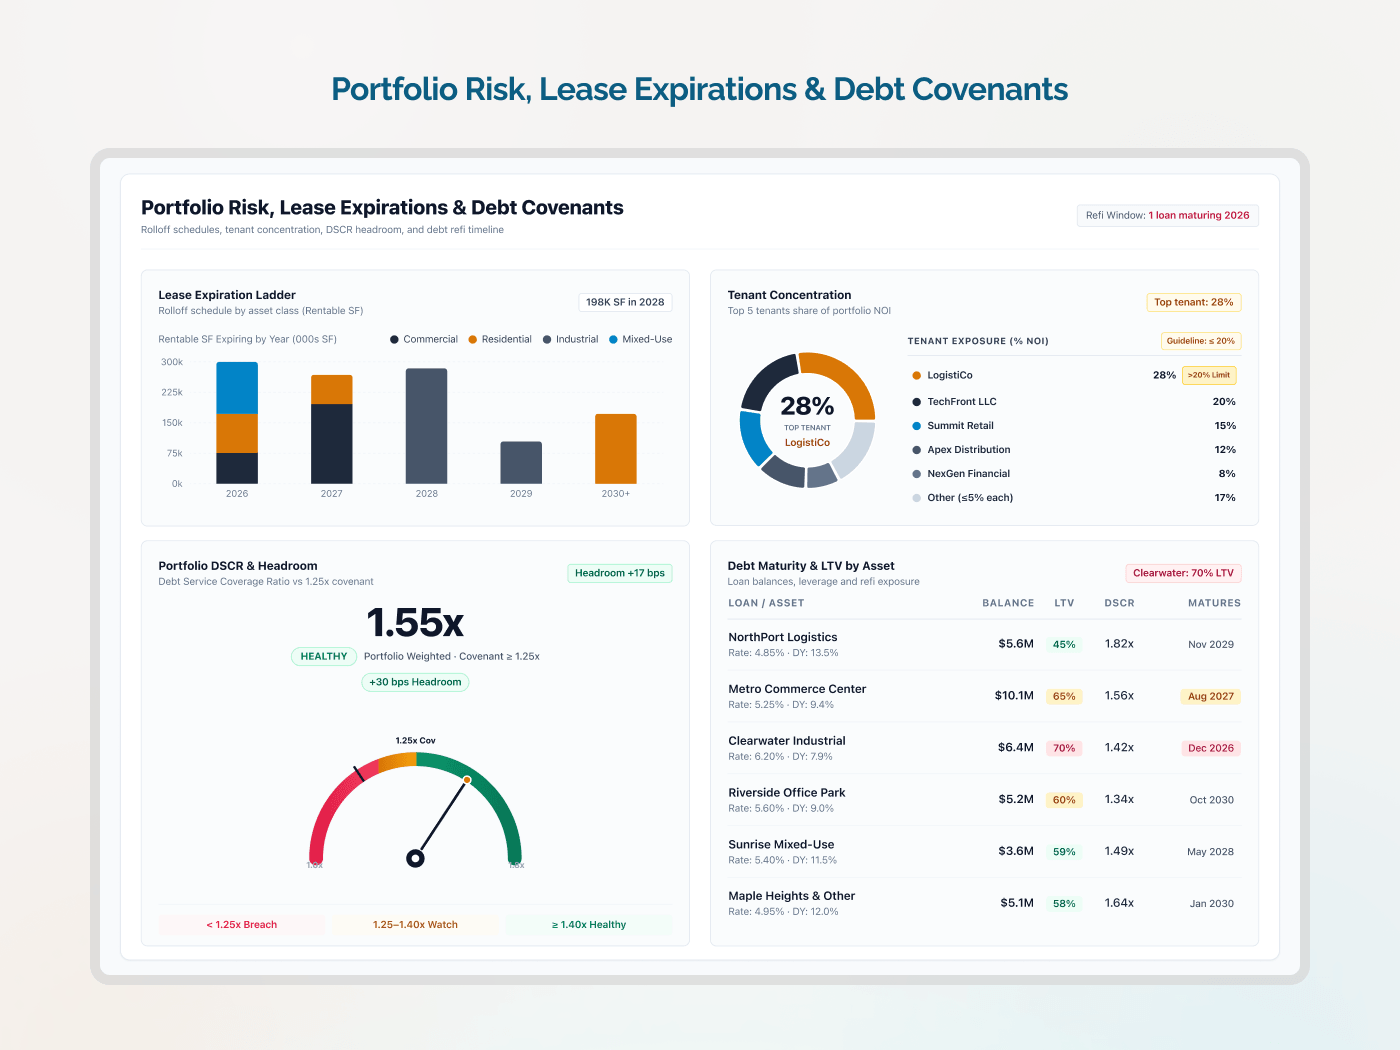
Lease Expirations & Debt Covenants
Monitors loan safety margins, top tenant risk, and loan maturity dates.
Tech Stack
A clean, modern setup built for fast loading and responsive filtering:
Data Sources
Syncs rent rolls, operating costs, and loan terms from property feeds.
Property & Loan APIsDatabase
Stores property records, rents, and loan schedules in Supabase.
SupabaseServer Logic
Calculates yields, debt ratios, and expiration ladders on demand.
Next.js Server ActionsUser Interface
Clean interface with interactive gauges, dark mode, and property tables.
Next.js & TailwindResults & Impact
The new dashboard gave investment partners clear numbers they could trust:
Modular Analytics Architecture
Built a modular component architecture with reusable React charts and financial data tables for rapid dashboard scaling.
Automated Data Sync
Connected property data directly into Supabase, removing manual spreadsheets.
Standardized Metrics
Unified formulas for yield, debt coverage, and occupancy across the team.
Faster Portfolio Reviews
Gave managers quick visibility into upcoming loan deadlines and lease expiries.
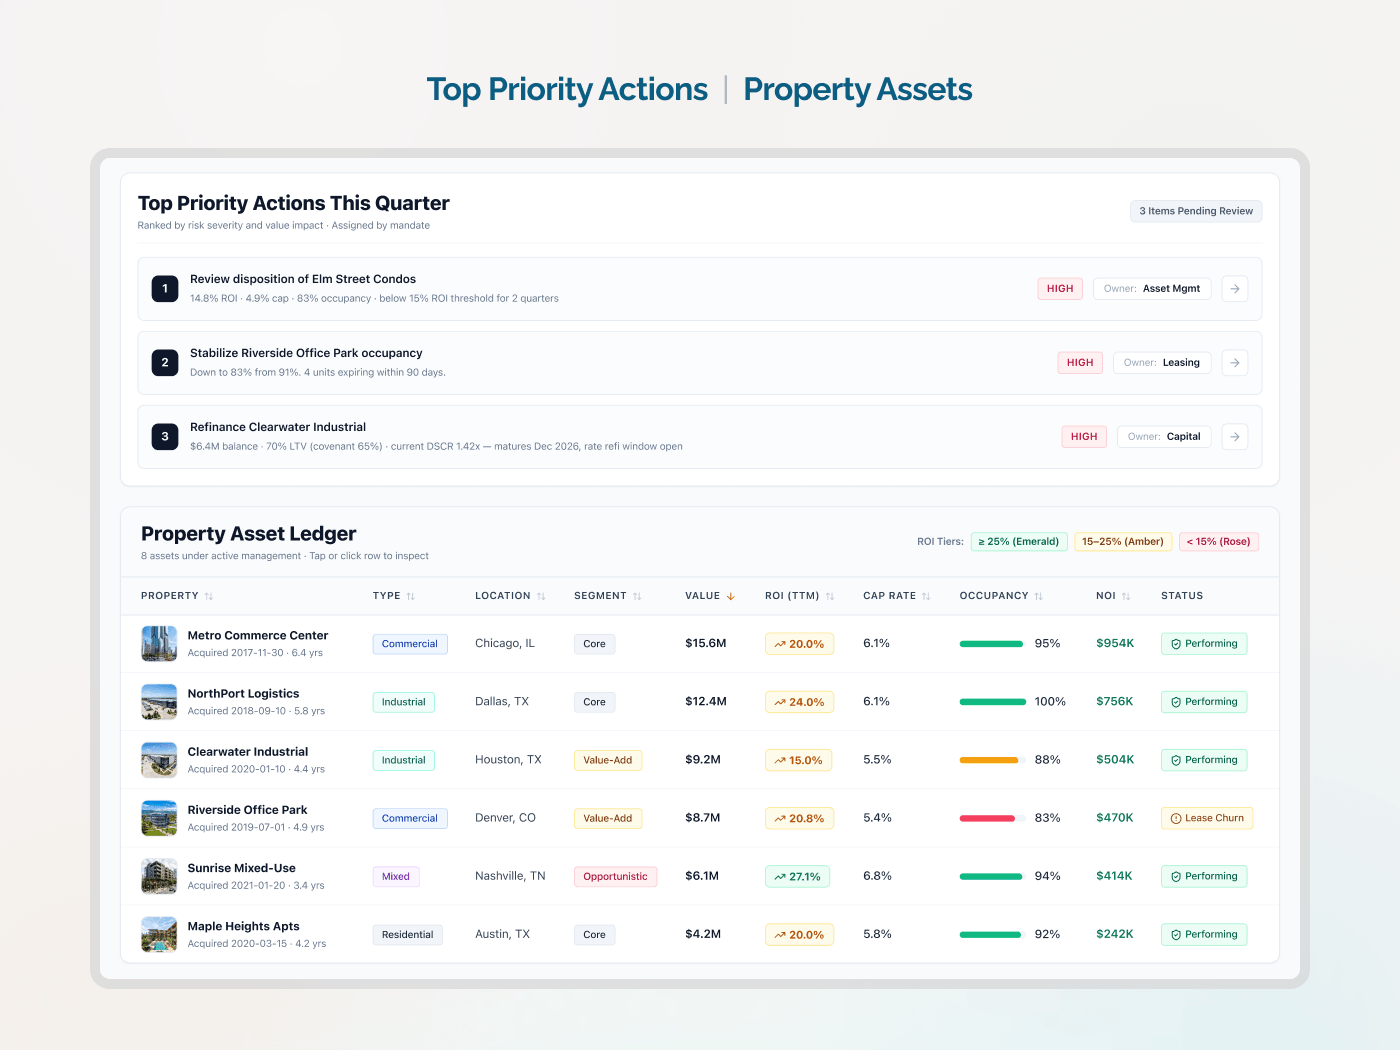
Priority Actions & Asset Ledger
Lists priority properties for review and refinancing with a full asset table.
Ongoing Maintenance & Usability
After delivering the dashboard, work shifted to fixing bugs, improving usability, adding new metrics, and adjusting existing calculations.
Planning Additional Data Sources
Planning the addition of new property management feeds and loan servicing APIs to expand portfolio coverage.
Gallery
All dashboard views developed for the platform. Click any view to inspect full size: